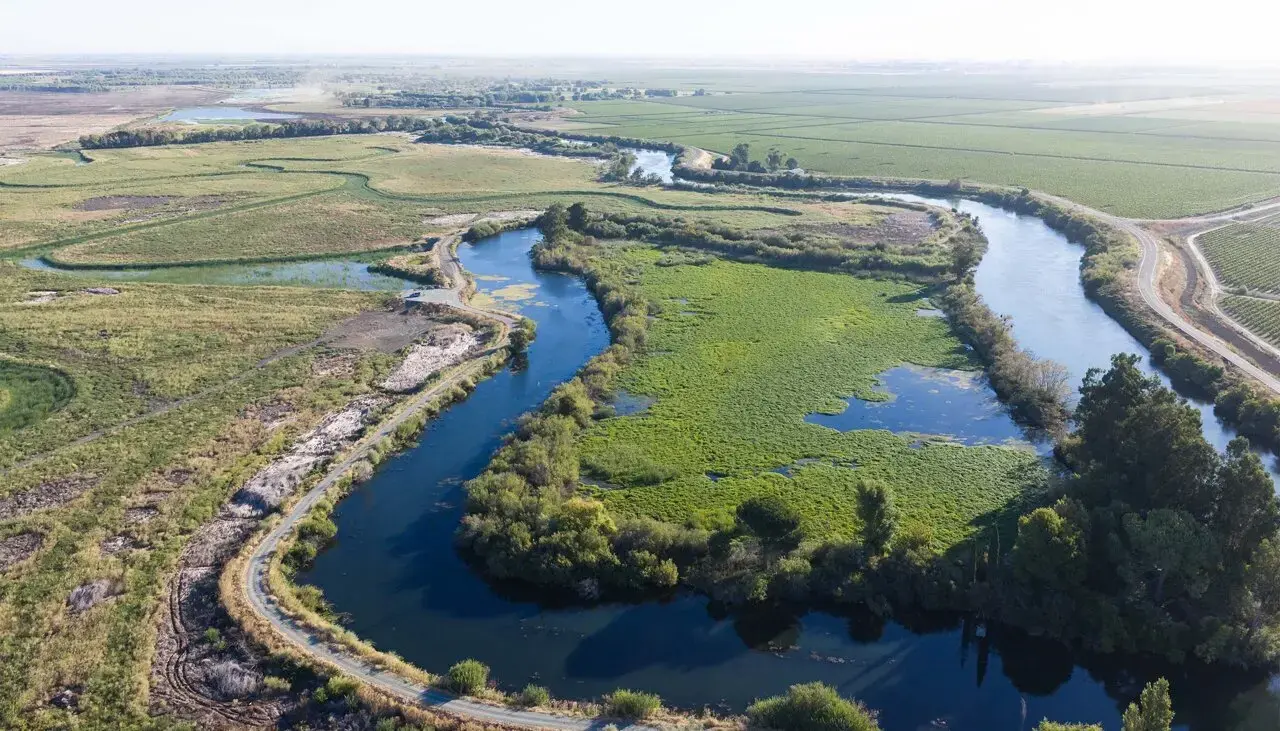
How does the tool help farmers and cities adapt to water scarcity?
A team of researchers at the University of California, Berkeley has launched a new online platform that maps California’s water use in unprecedented detail, revealing how water moves across the state from source to tap. The tool, called the California Water Atlas, combines satellite data, groundwater measurements, and municipal records to show real-time flows and long-term trends. It allows users to see exactly how much water is used for agriculture, urban consumption, and environmental needs in every county and watershed. The project aims to improve transparency in a state where water rights have been fiercely debated for over a century.
Latest news
 Swedish Voters Choose New Parliament as Left-Wing Coalition Projects to Win Majority
 Trump Announces End of US Tariff on Irish Whisky
 Frances Stonor Saunders, Author of CIA Cultural Espionage Exposé, Dies at 66
 Israel and Lebanon to Hold Security Talks in Rome This October
The atlas highlights growing pressures on California’s water system, especially as climate change alters precipitation patterns and increases the frequency of droughts. By visualizing where water is stored, diverted, and consumed, the tool helps identify inefficiencies and vulnerabilities in the current infrastructure. Researchers say the data shows that a significant portion of water is lost to evaporation and leaks in aging canals and pipelines, particularly in the Central Valley. The platform also tracks how groundwater pumping has intensified during dry years, leading to land subsidence and depleted aquifers in regions like the San Joaquin Valley.
What role does the environment play in the state’s water balance?
The atlas provides farmers with field-level insights into irrigation efficiency, allowing them to compare water use with neighboring farms and adjust practices accordingly. Urban planners can use the data to assess the impact of conservation measures and plan for future demand under different climate scenarios. One Central Valley almond grower noted that after using the tool, he reduced his water use by 15% without affecting yields by switching to precision irrigation. City officials in Los Angeles have begun using the atlas to model how stormwater capture could offset imported water needs during dry periods.
The platform reveals that environmental water allocations—meant to sustain rivers, wetlands, and fish populations—often fall short during droughts, even when human uses are prioritized. In 2022, the atlas showed that less than 40% of the water deemed necessary for ecosystem health reached the Sacramento-San Joaquin Delta during peak summer months. Scientists warn that continued imbalance could trigger further declines in salmon populations and worsen saltwater intrusion in the delta. The tool makes these trade-offs visible, helping policymakers evaluate whether current water allocation strategies are sustainable.
How often is the data in the California Water Atlas updated? The platform integrates real-time satellite and sensor data where available, with most datasets refreshed monthly or seasonally. Groundwater levels are updated quarterly based on state monitoring wells, while agricultural use estimates are revised annually using crop reports and evapotranspiration models.
Frequently Asked Questions
Can the public access the tool for free? Yes, the California Water Atlas is freely available online to anyone with an internet connection. No registration is required to view maps, download data, or explore water use trends by region or sector.
Does the tool predict future water shortages? While the atlas does not generate forecasts, it provides historical trends and current conditions that can be used alongside climate models to assess future risks. Researchers are working to integrate scenario-planning features that will allow users to project water availability under different warming and precipitation scenarios.